NVDA: Stick with technicals and mind the candles

NVDA trade plan

The idea was for the price to bounce from MA20. It did on June 1st but I didn't notice the bearish candle the following day. I guess my judgement was clouded by Nvidia's JH's keynote speech in Taiwan. Too much speculation lead to a miscalculation on my part.

I should have sold on the black reversal candle with a long wick.

Trade Plan

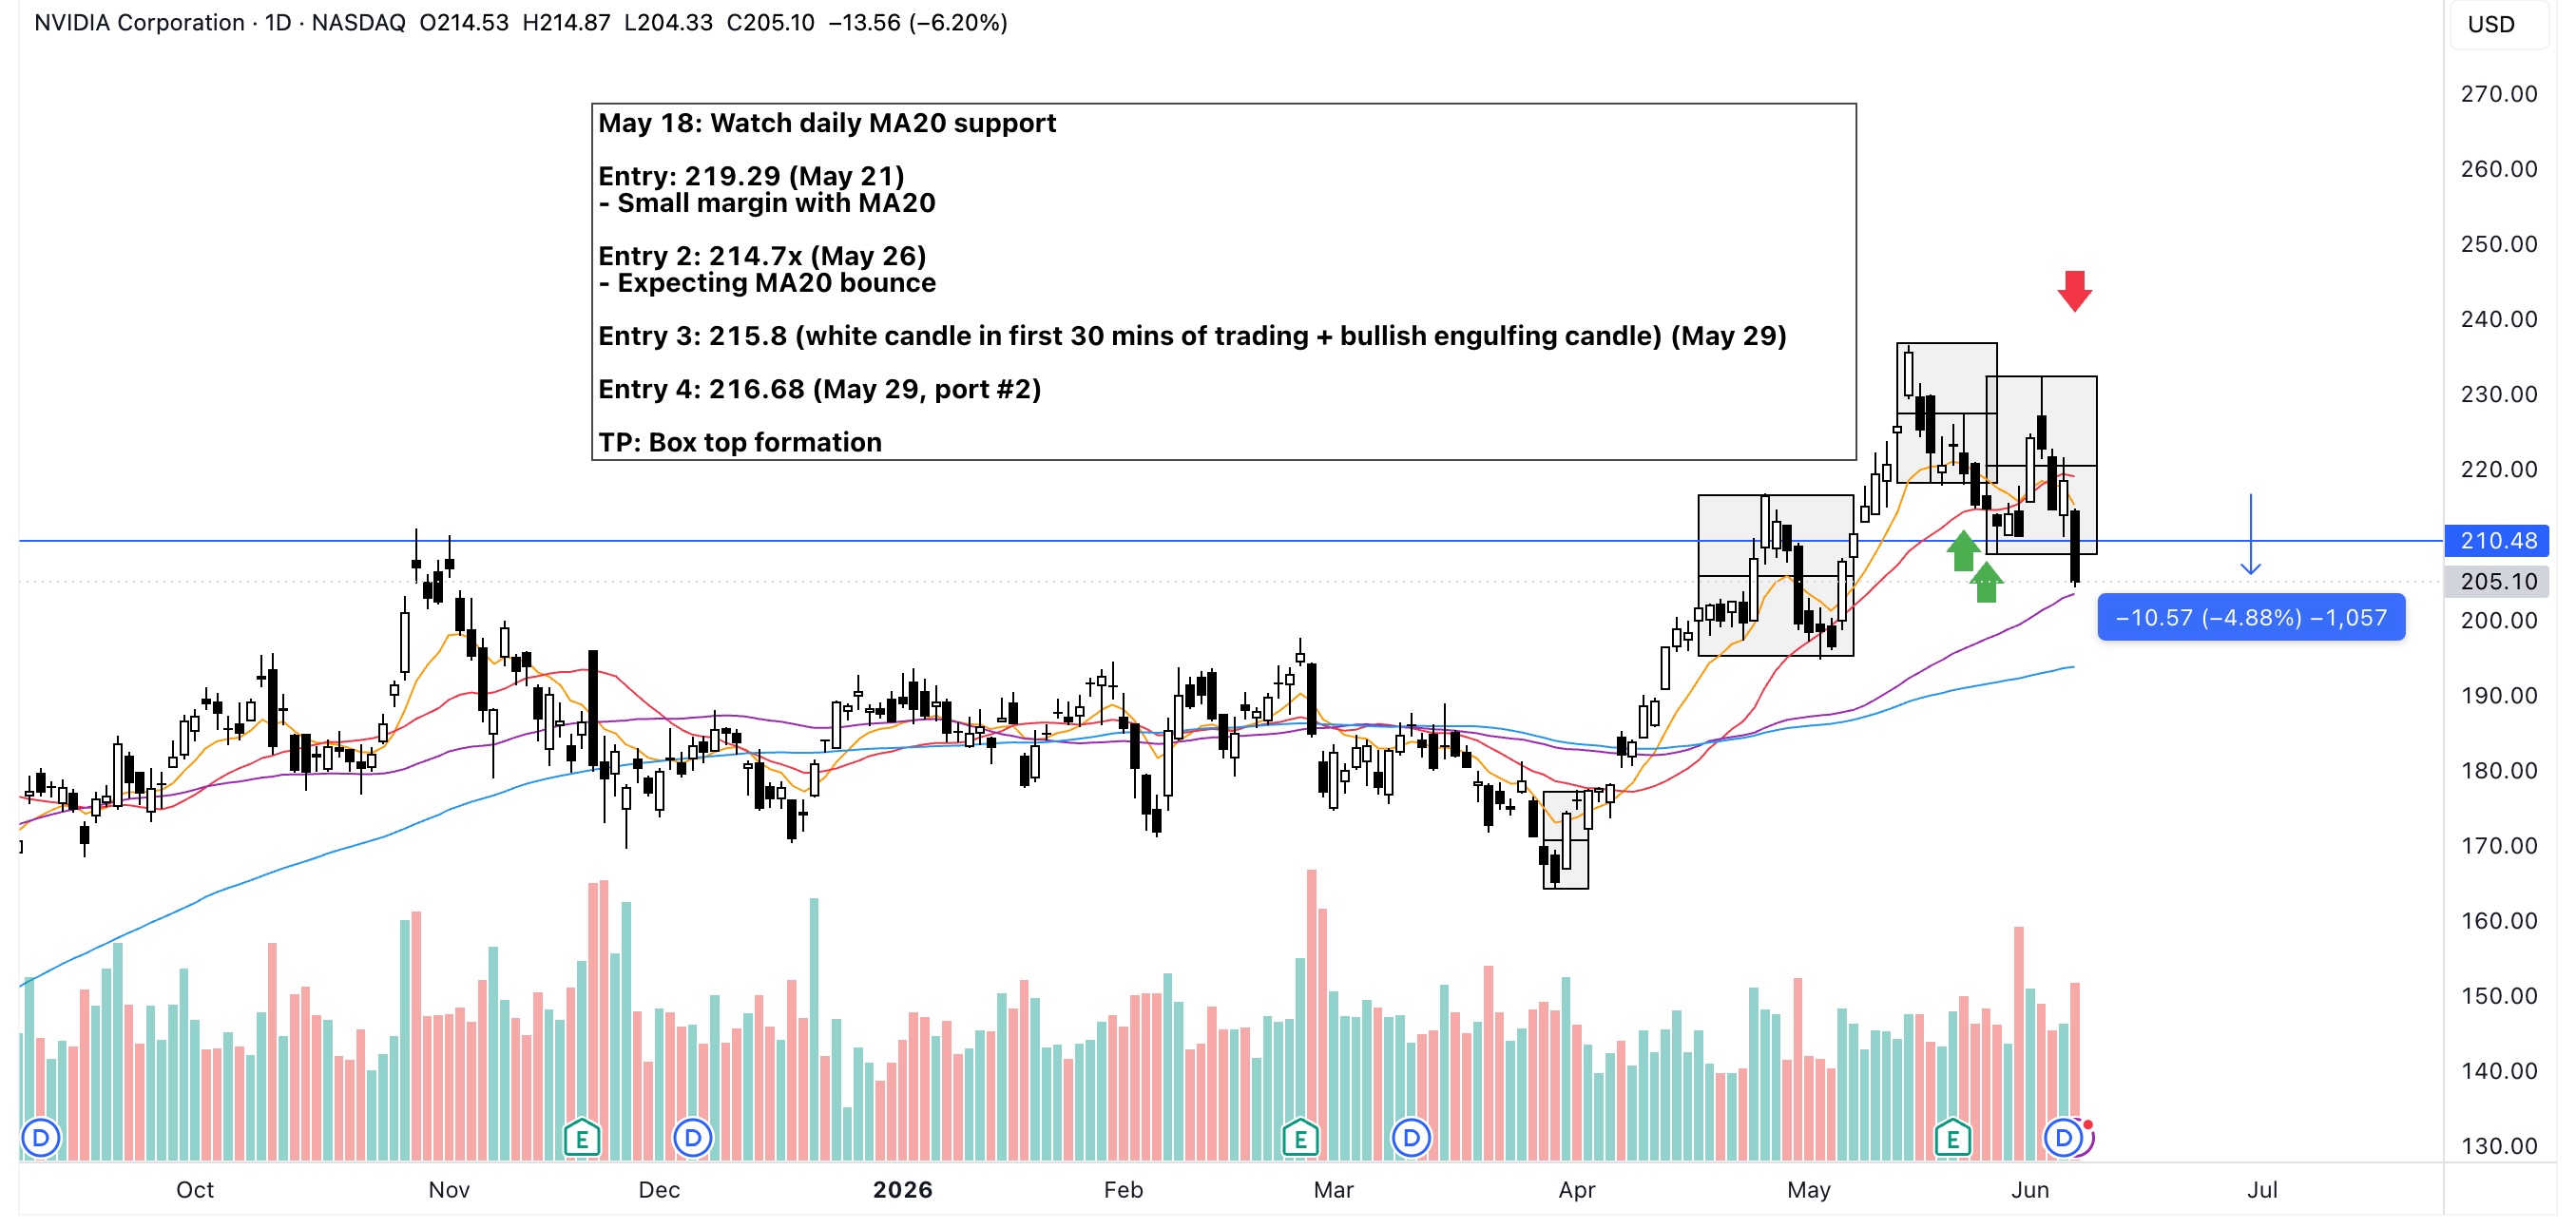
May 18: Watch daily MA20 support

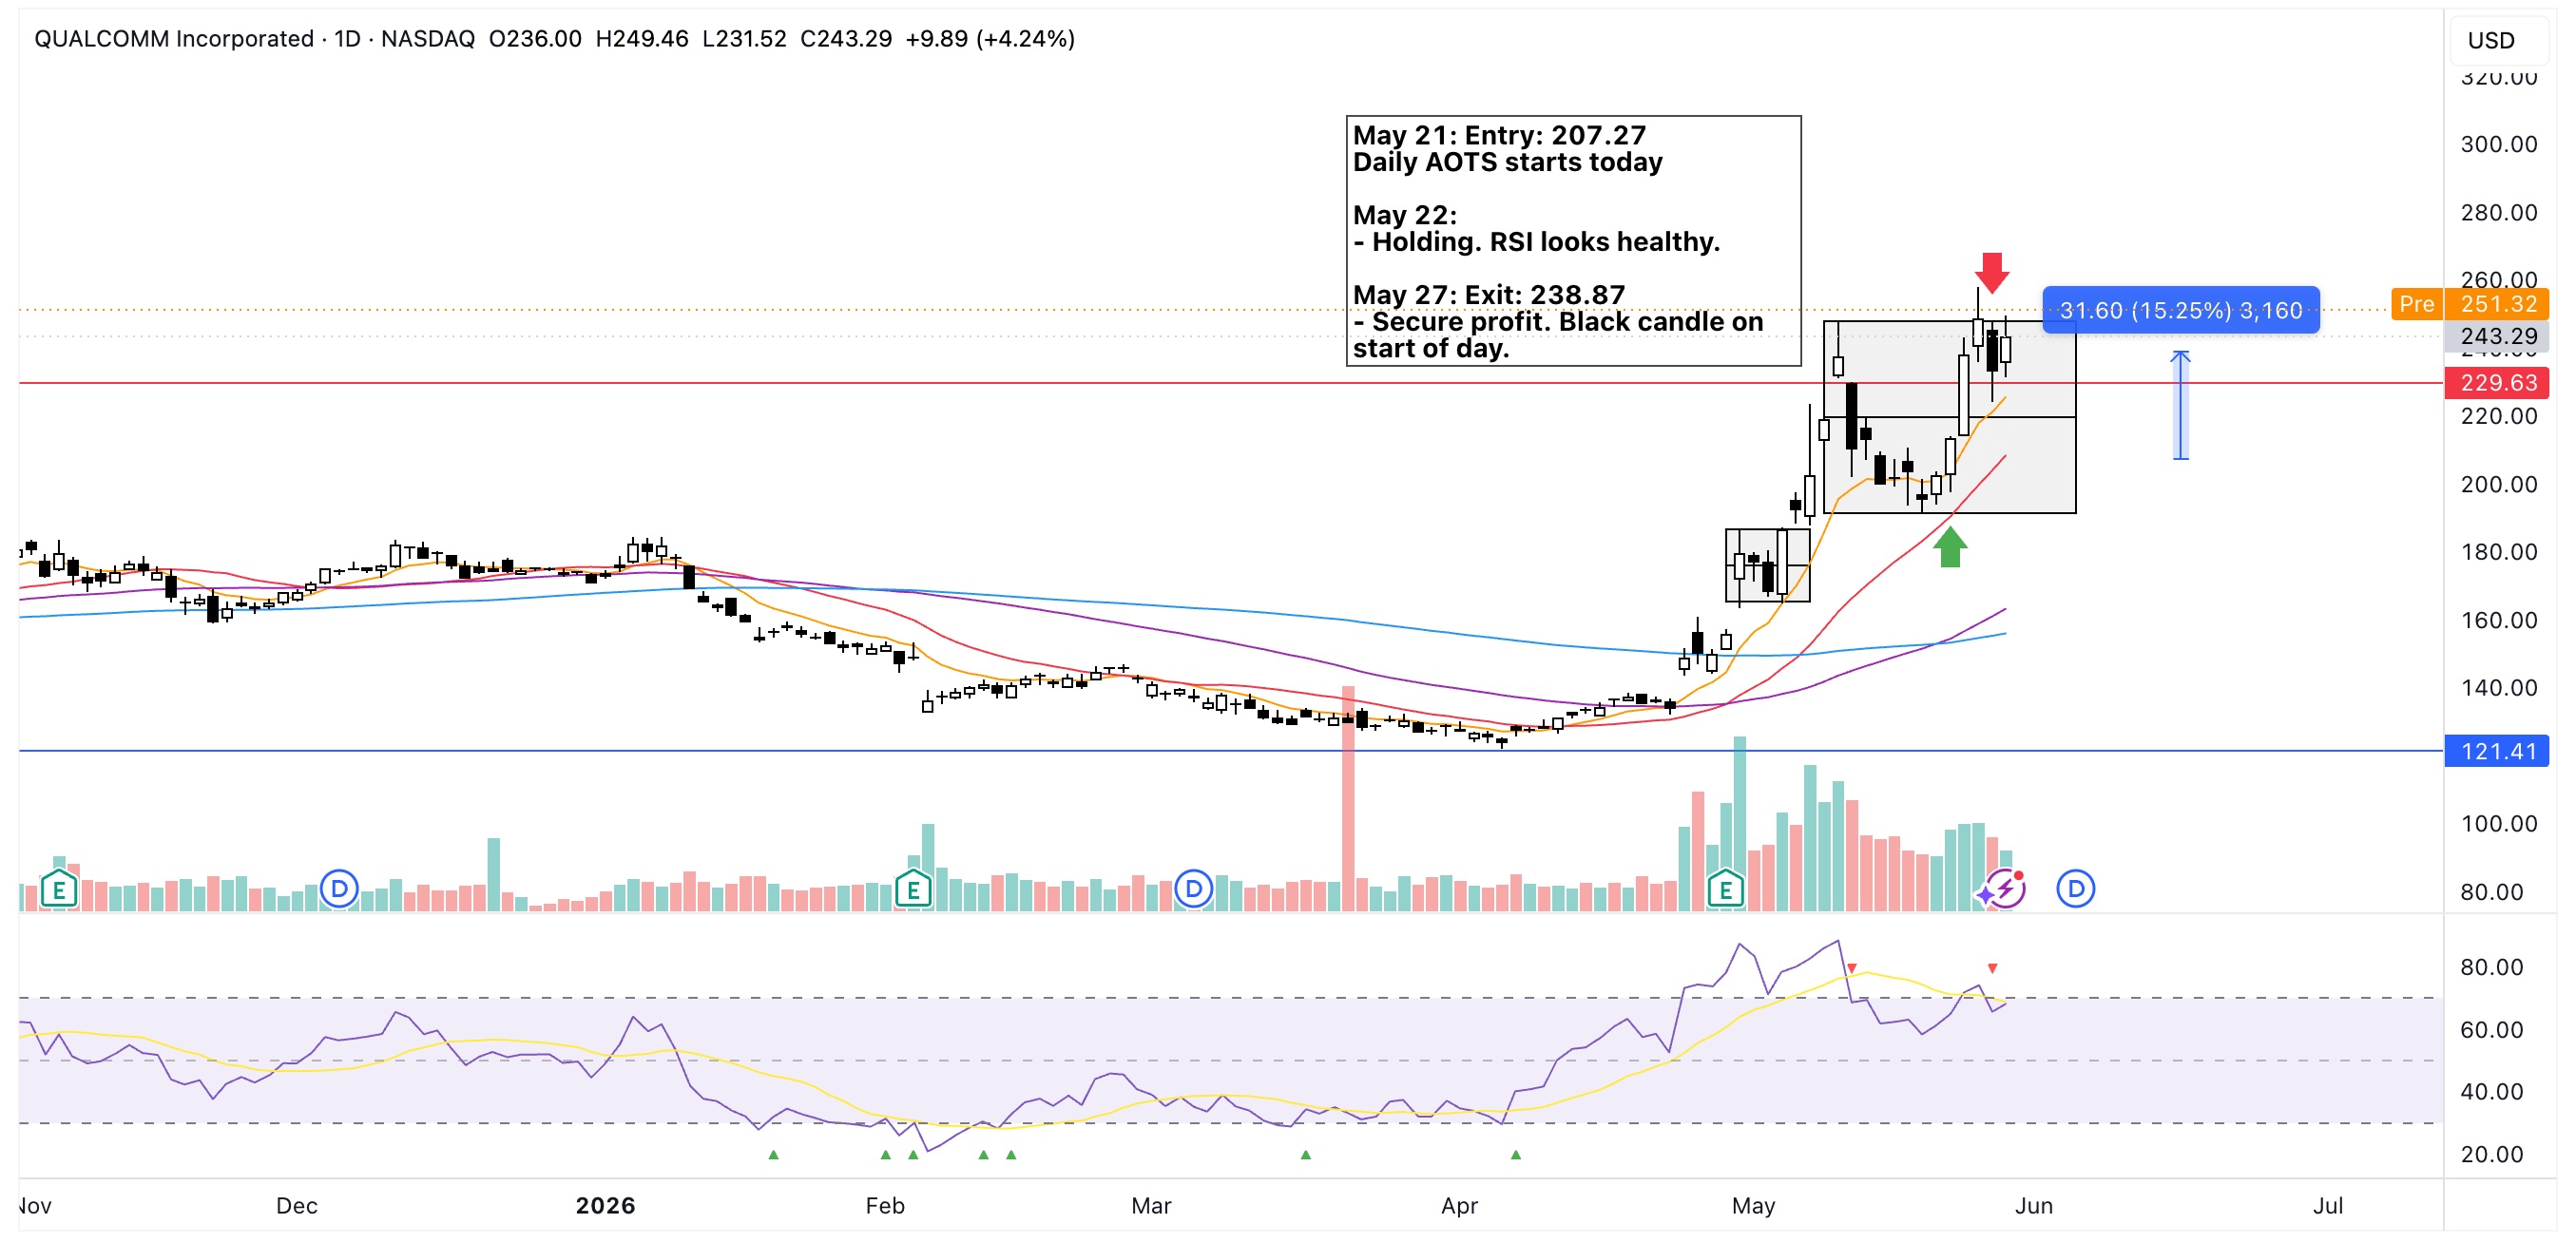
Entry: 219.29 (May 21) - Small margin with MA20 - Small margin with major TSL

Entry 2: 214.7x (May 26) - Expecting MA20 bounce

Entry 3: 215.8 (white candle in first 30 mins of trading + bullish engulfing candle) (May 29)

Entry 4: 216.68 (Go trade, 8.97 shares)

TP: Box top formation

Notes:

May 29: - 15 min candle broke MA100

June 1: - Nvidia JH keynote speech in Taiwan looks like to be a catalyst. (Why is this here???) - Day 0 of box top. - ~6% price increase with good volume.

June 2-4: - No notes

Exit

June 5 - Sold EOD on long black candle. - Also today was the one of the longest black candles of NASDAQ after a long time.

NVDA trade plan

Mind the candles EVERYDAY! Watch out for reversals!

3436 (SUMCO): Swing to a breakout

3436 trade plan

My biggest JP market win to date! From an average entry price of 3020 to a 4303 exit, that's about a 43% gain.

To be honest I feel like I'm finding my niche with swing trading. I know it's a bull market and I still need to prove myself when things go upside down, but wins like this helps you be more confident in executing your trade ideas.

Trade Plan

May 11: AOTS on weekly starts. Currently on EMA9 support.

Entry1: 2980 (May 19) - 50% buy on day-1 (confirmation) candle

Entry2: 3060 (May 20) - 50% buy on day-2 (validation) candle

Target price: ~3750 level for a ~23% gain CL: 7% to MA20 trend line RRR: 3:1

Notes

May 22: RSI is healthy (60 as of yesterday EOD).

May 28: Daily MA20 seems to be holding.

May 29: Box BO with strong volume

Jun 1: BO confirmation with strong volume.

Exit

Jun 2: Sold EOD at first black candle.

3436 June 2 price action

Price was in the lower level of -7% to -5% in the first half of the trading day then started to climb back up in second half. So far price movement in the JP market tends to be better towards the EOD.

So far price movement in the JP market tends to be better towards the EOD.

Also, the JP market seems to have a warm-up period in the first 30 mins of the day. Avoid trading during this time.

5016 (JX Advanced Metal Corp): A bet on the weekly MA

5016 trade plan

Last May 20 I noticed a big pull back with a potential weekly MA20 support. I bet on candle-0 of that MA support line hoping for a good price action the following week.

5016 trade plan

Monday came and the reality looked to be going the opposite way.

Price action was too slow. Then I realized I never looked at the RSI level before entering.

This was also my first time buying below MA50.

Concluded capital is better elsewhere.

Create case study for later but this looks to be a successful exit after today's daily MA100 breakdown.

Check the daily RSI even when betting on weekly!

QCOM: A quick trade for a reasonable gain

QCOM trade plan

This was a quick one.

Sold on the third candle for a quick 15.25% gain.

MAs just entered AOTS stage so probably there's more room for growth.

Day-wise candle also broke a major resistance area and now trading ATH.

Today (May 29) pre-market price is at +3% which is at a level a tiny bit above the last major box.

RSI looks on track to breakout of RSI70 again.

I've been here warming my seat thinking about a re-entry. More later. Gambatte, self!

ARM: Swinging from the bottom to a breakout

ARM trade plan

Trade Plan (May 12)

  • Entry price: 211.45
  • CL1: -5.2% (200.86 at MA20 support)
  • CL2: -10% (190.21 at box bottom)
  • TP on box top: 13.19% (239.4)
  • Check daily MA20 support
  • Check 4H MA50 support

Notes

May 21

  • At EOD: strong box breakout overtaking the initial TP. Also with good volume. Decided not sell for now.
  • Monitor price movement the following day.

May 22

  • Early trading hours shows strong demand, though it's end of week so watch out for price action more carefully.
  • Gap up opening.
  • Missed to check daily MA20 and 4H MA50 previously. But as of today both supports were followed.
  • Box breakout occurred after hitting support level
  • At EOD: Long white candle with almost no wick. Decided not to take profit for now. Monitor again tomorrow.
  • RSI looks good.

May 26

  • First trading of the week.
  • Holding. RSI looks healthy.

Thoughts on Exit

Actual exit price: 313.14 (May 27)

  • Noticed price action in smaller intervals was not holding well. (Black candle in morning hours).
  • Secured profit. Watch out for a re-entry.

SMFG (8316): A cup and handle story

ICT trade plan

Finally was able to gain back what I lost on this pick from almost 3 months back.

Re-entry point mainly anchored on the daily MA100 and weekly MA20 of the stock expecting a cup and handle pattern. And it did-- the handle was supported by MA100 on the daily chart.

As for the exit, a pullback seemed more common than a follow through of the breakout candle. I exited based on this. Though this morning (day after the exit), the price jumped around 2.5%.

Should I consider to sell the next morning after the breakout candle?

Also in hindisght, the index formed the same pattern.

ICT trade plan

Don't forget to check the index once in a while

APLD: Bought on weak signals

APLD cut loss

This one hurt and hit differently because it was the first trade I executed with my new broker.

There's nothing much to say here since there weren't clear buy signals to begin with.

Another loss to be charged to experience!

Always have a trade plan!

MYNLD: Buy on brain fart

MYNLD trade plan

Honestly, I don't know what got into me buying this stock. Perhaps it was the hype seeing the price at a very low price but with the same growth potential as ICT. Add to that I just exited my ICT trade so I was eager of entering the market again. But where's the TA in that?

Don't rush to re-enter the market. Chill, bruh!

INTC: Buy on gap

INTC buy on gap

This is probably my first successful buy on gap trade. I saw the stock surging on the first half of the trading day (first hour if I remember correctly) and just bought without hesitation. But this was mainly because I wasn't treating my US account very seriously. It was an account I opened during the pandemic and put something there to see how much it will grow over time.

The actual upside could have been higher if only I had an exit plan. If I sold on box confirmation or validation, profit could have been 36%.

Key takeaways

  • Do NOT hold fast rising stocks for long
  • Always monitor the delta between price and MA trend line.
  • Consider to sell on box confirmation

SMFG (8316): A loss to the bears

ICT trade plan

My entry here was on spot. The idea was for the price to bounce back from EMA9.

EMA9 was also close to MA20 so it could act as another support level. Delta between these two lines was about 3.7% so that's another 1.3% headroom from the latter.

13 candles later the price potential profit reached 13.3%. Realistically, I could have secured my profit on the next two lower candles but obviously that didn't happen. If it did, that could still have been a profit of 5.8%.

The takeaway: Exit on box formation